Getting Started
Language
Streaming expressions and math expressions are function languages that run inside SolrCloud. The languages consist of functions that are designed to be composed to form programming logic.
Streaming expressions are functions that return streams of tuples.
Streaming expression functions can be composed to form a transformation pipeline.
The pipeline starts with a stream source, such as search, which initiates a stream of tuples.
One or more stream decorators, such as select, wraps the stream source and transforms the stream of tuples.
Math expressions are functions that operate over and return primitives and in-memory arrays and matrices. The core use case for math expressions is performing mathematical operations and visualization.
Streaming expressions and math expressions can be combined to search, sample, aggregate, transform, analyze and visualize data in SolrCloud collections.
Execution
Solr’s /stream request handler executes streaming expressions and math expressions.
This handler compiles the expression, runs the expression logic and returns a JSON result.
Admin UI Stream Panel
The easiest way to run streaming expressions and math expressions is through the Stream Screen in the Solr Admin UI.
A sample search streaming expression is shown in the screenshot below:

A sample add math expression is shown in the screenshot below:

Curl Example
The HTTP interface to the /stream handler can be used to send a streaming expression request and retrieve the response.
Curl is a useful tool for running streaming expressions when the result needs to be spooled to disk or is too large for the Solr admin stream panel.
Below is an example of a curl command to the /stream handler.
curl --data-urlencode 'expr=search(enron_emails,
                                   q="from:1800flowers*",
                                   fl="from, to",
                                   sort="from asc")' http://localhost:8983/solr/enron_emails/stream
The JSON response from the stream handler for this request is shown below:
{"result-set":{"docs":[
   {"from":"1800flowers.133139412@s2u2.com","to":"lcampbel@enron.com"},
   {"from":"1800flowers.93690065@s2u2.com","to":"jtholt@ect.enron.com"},
   {"from":"1800flowers.96749439@s2u2.com","to":"alewis@enron.com"},
   {"from":"1800flowers@1800flowers.flonetwork.com","to":"lcampbel@enron.com"},
   {"from":"1800flowers@1800flowers.flonetwork.com","to":"lcampbel@enron.com"},
   {"from":"1800flowers@1800flowers.flonetwork.com","to":"lcampbel@enron.com"},
   {"from":"1800flowers@1800flowers.flonetwork.com","to":"lcampbel@enron.com"},
   {"from":"1800flowers@1800flowers.flonetwork.com","to":"lcampbel@enron.com"},
   {"from":"1800flowers@shop2u.com","to":"ebass@enron.com"},
   {"from":"1800flowers@shop2u.com","to":"lcampbel@enron.com"},
   {"from":"1800flowers@shop2u.com","to":"lcampbel@enron.com"},
   {"from":"1800flowers@shop2u.com","to":"lcampbel@enron.com"},
   {"from":"1800flowers@shop2u.com","to":"ebass@enron.com"},
   {"from":"1800flowers@shop2u.com","to":"ebass@enron.com"},
   {"EOF":true,"RESPONSE_TIME":33}]}
}
Visualization
The visualizations in this guide were performed with Apache Zeppelin using the Zeppelin-Solr interpreter.
Zeppelin-Solr Interpreter
An Apache Zeppelin interpreter for Solr allows streaming expressions and math expressions to be executed and results visualized in Zeppelin. The instructions for installing and configuring Zeppelin-Solr can be found on the Github repository for the project: https://github.com/lucidworks/zeppelin-solr
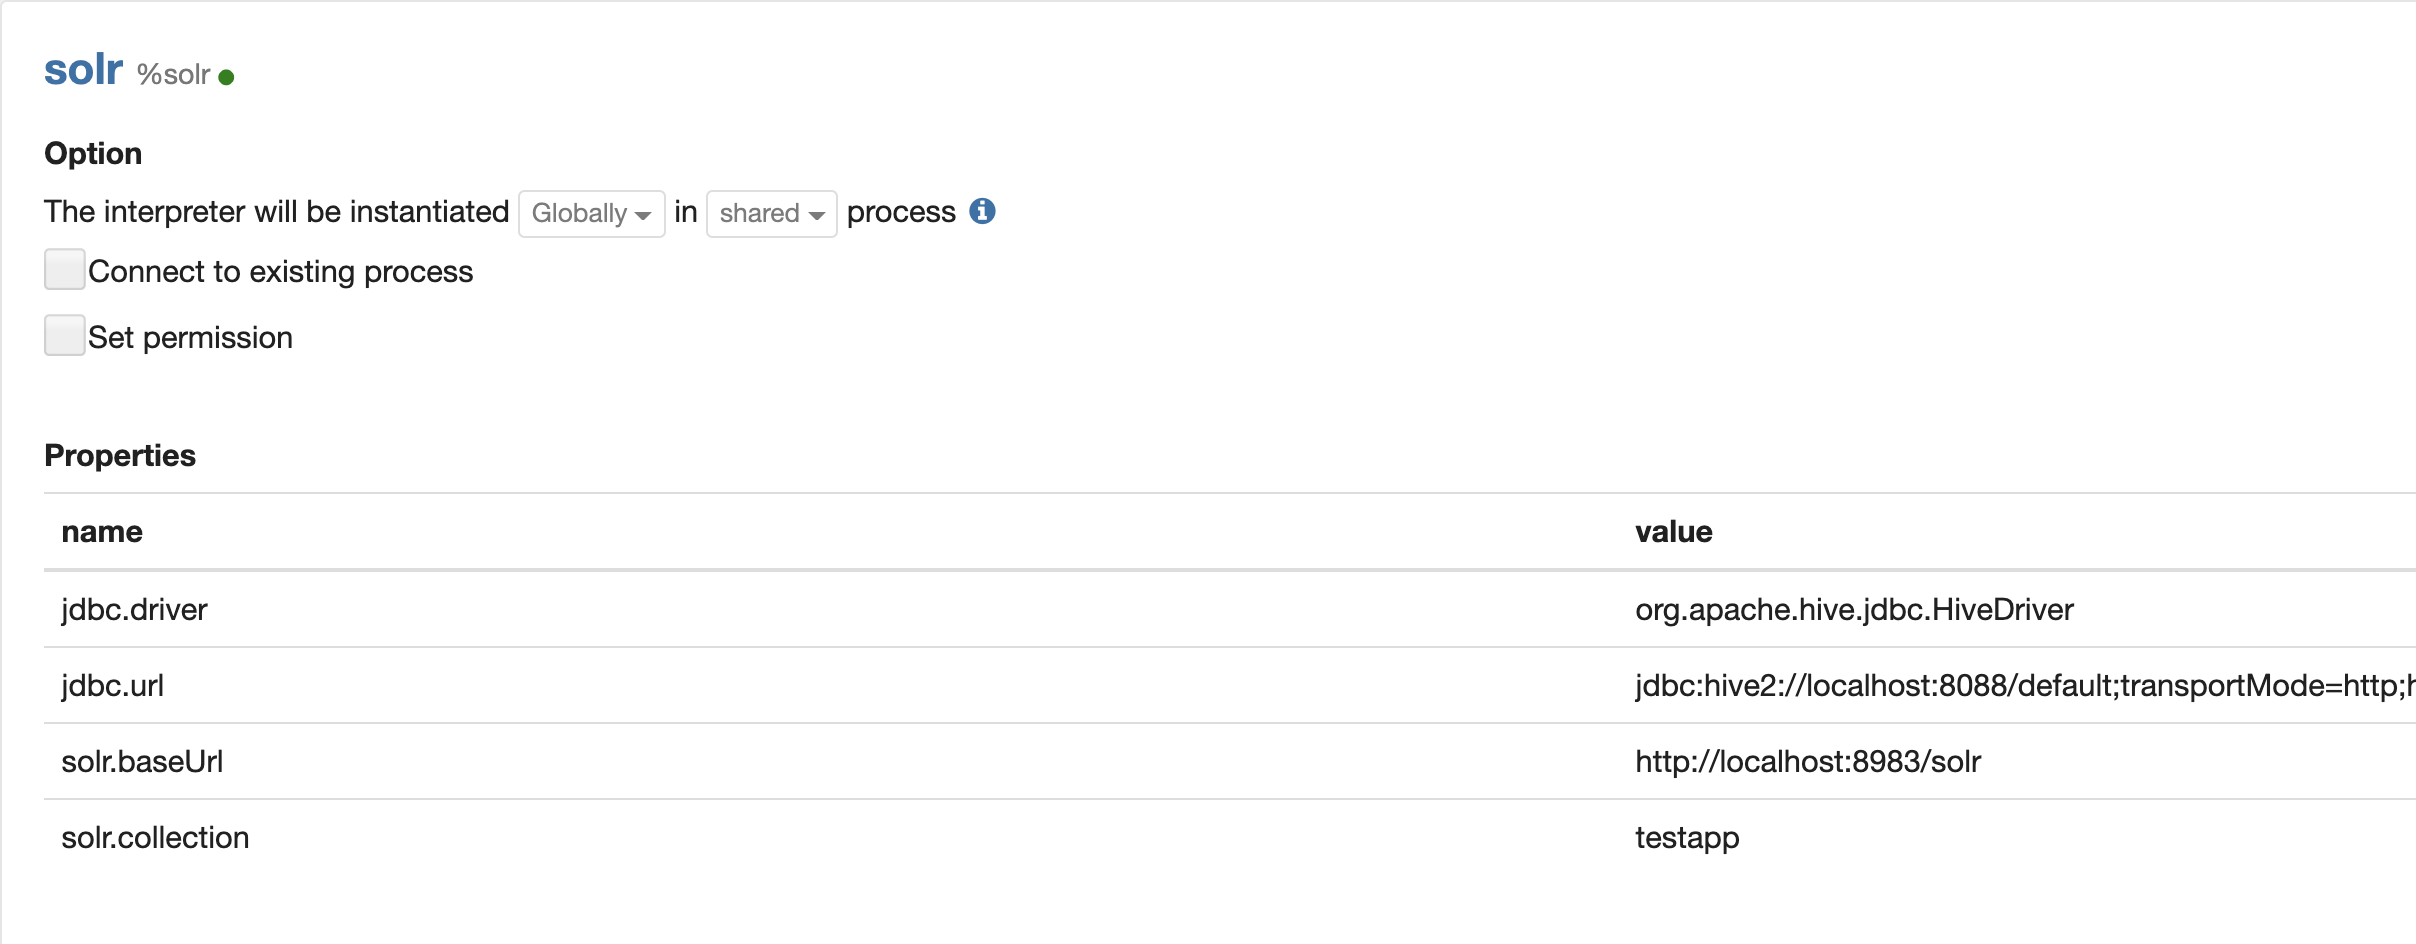
Once installed the Solr Interpreter can be configured to connect to your Solr instance. The screenshot below shows the panel for configuring Zeppelin-Solr.

Configure the solr.baseUrl and solr.collection to point to the location where the streaming expressions and math expressions will be sent for execution.
The solr.collection is just the execution collection and does not need to hold data, although it can hold data.
streaming expressions can choose to query any of the collections that are attached to the same SolrCloud as the execution collection.
zplot
Streaming expression result sets can be visualized automatically by Zeppelin-Solr.
Math expression results need to be formatted for visualization using the zplot function.
This function has support for plotting vectors, matrices, probability distributions and 2D clustering results.
There are many examples in the guide which show how to visualize both streaming expressions and math expressions.