JVM Settings
Optimizing the JVM can be a key factor in getting the most from your Solr installation.
Configuring your JVM is a complex topic and a full discussion is beyond the scope of this document. Luckily, most modern JVMs are quite good at making the best use of available resources with default settings. The following sections contain a few tips that may be helpful when the defaults are not optimal for your situation.
For more general information about improving Solr performance, see Solr Performance Factors in the Solr Wiki.
Choosing Memory Heap Settings
The most important JVM configuration settings control the heap allocated to the JVM: -Xms, which sets the initial size of the JVM’s memory heap, and -Xmx, which sets the maximum size of the heap.
Setting these two options to the same value is a common practice.
Heap size is critical and unfortunately there is no "one size fits all" solution, you must test with your data and your application. The best way to determine the correct size is to analyze the garbage collection (GC) logs located in your logs directory. There are various tools that help analyze these logs and, in particular, show the amount of memory used after GC has completed (GCViewer and GCEasy are two). Also you can attach jconsole (distributed with most Java runtimes) to check memory consumption as Solr is running. This will show the absolute minimum amount of memory required; adding 25-50% "headroom" is a reasonable starting point.
There are several points to keep in mind:
-
Running Solr with too little "headroom" allocated for the heap can cause excessive resources to be consumed by continual GC. Thus the 25-50% recommendation above.
-
Solr makes extensive use of MMapDirectory, which uses RAM not reserved for the JVM for most of the Lucene index. Therefore, as much memory as possible should be left for the operating system to use for this purpose.
-
The heap allocated should be as small as possible while maintaining good performance. 8-16Gb is quite common, and larger heaps are sometimes used. When heaps grow to larger sizes, it is imperative to test extensively before going to production.
-
The G1GC garbage collector is currently preferred when using a JVM that supports it (Java 9 and later).
-
Modern hardware can be configured with hundreds of gigabytes of physical RAM and many CPUs. It is often better in these cases to run multiple JVMs, each with a limited amount of memory allocated to their heaps. One way to achieve this is to run Solr as a Docker container.
-
It’s good practice to periodically re-analyze the GC logs and/or monitor with Metrics Reporting to see if the memory usage has changed due to changes in your application, number of documents, etc.
-
Solr will run with an option that causes the JVM to crash on OutOfMemoryError exceptions. This will forcefully stop Solr when a system resource is exhausted rather than continue in an indeterminate state. You can additionally request a heap dump on OOME through the values in
solr.in.sh -
All current (Java 11) garbage collectors can hit "stop the world" collections, which suspend the JVM until completed. If, through monitoring, these garbage collections are frequent and greater than your application can tolerate, additional tuning should be considered. "Stop the world" pauses greater than 5 seconds are rarely acceptable, and having them be less than 1 second is desirable.
Consult your JVM vendor’s documentation for specifics in your particular case, the recommendations above are intended as starting points.
Use the Server HotSpot VM
If you are using Sun’s JVM, add the -server command-line option when you start Solr.
This tells the JVM that it should optimize for a long running, server process.
If the Java runtime on your system is a JRE, rather than a full JDK distribution (including javac and other development tools), then it is possible that it may not support the -server JVM option.
Test this by running java -help and look for -server as an available option in the displayed usage message.
Checking JVM Settings
System Request Handler
A great way to see what JVM settings your server is using, along with other useful information, is to use the admin request handler, /solr/admin/info/system.
This request handler will display a wealth of server statistics and settings.
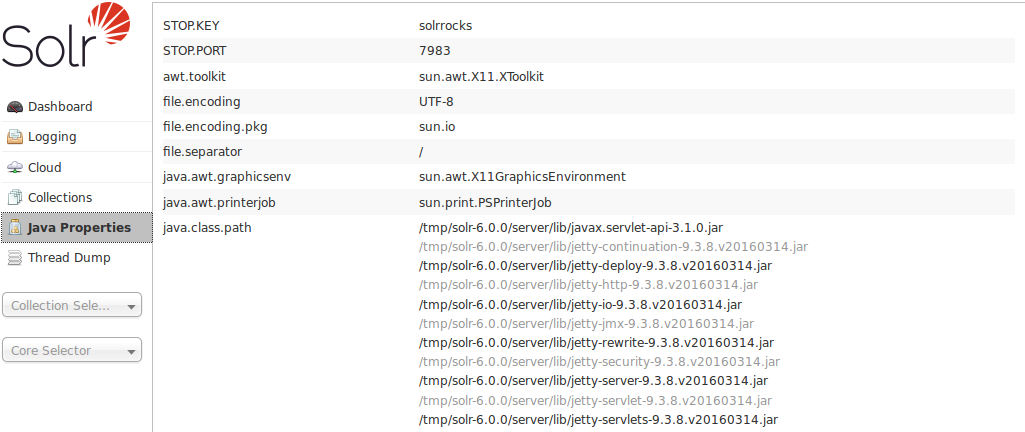
Java Properties Screen
Many of the system environment variables include Java settings, and these can be seen on the main Dashboard of the Admin UI.
The Java Properties screen, however, provides easy access to all the properties of the JVM running Solr, including the classpaths, file encodings, JVM memory settings, operating system, and more.
In the Admin UI, it is available in the left-hand menu Java Properties.
