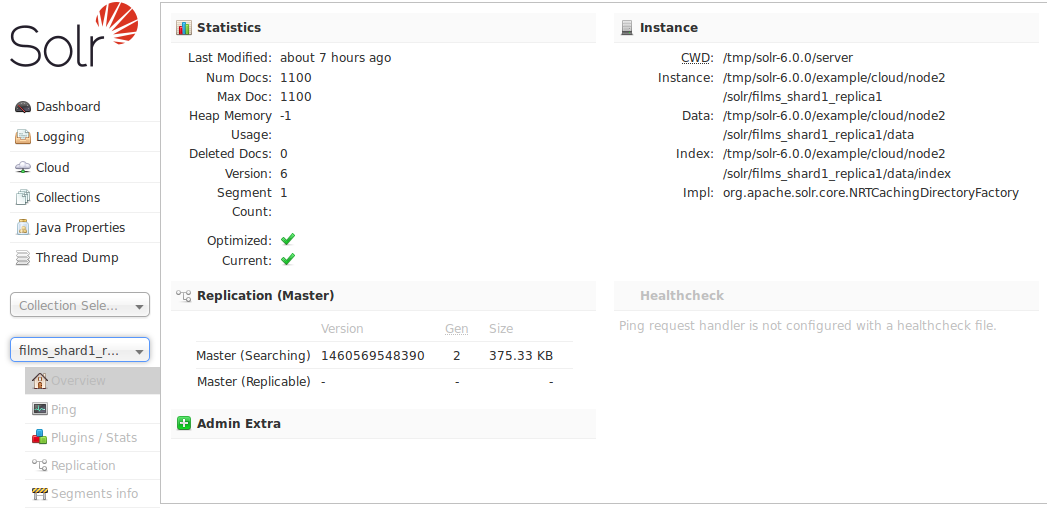
The Core-Specific tools are a group of UI screens that allow you to see core-level information.
In the left-hand navigation bar, you will see a pull-down menu titled "Core Selector". Clicking on the menu will show a list of Solr cores hosted on this Solr node, with a search box that can be used to find a specific core by name.
When you select a core from the pull-down, the main display of the page will show some basic metadata about the core, and a secondary menu will appear in the left nav with links to additional core specific administration screens.
You can also define a configuration file called admin-extra.html that includes links or other information you would like to display in the "Admin Extra" part of this main screen.

The core-specific UI screens are listed below, with a link to the section of this guide to find out more:
-
Ping - lets you ping a named core and determine whether the core is active.
-
Plugins/Stats - shows statistics for plugins and other installed components.
-
Replication - shows you the current replication status for the core, and lets you enable/disable replication.
-
Segments Info - Provides a visualization of the underlying Lucene index segments.
If you are running a single node instance of Solr, additional UI screens normally displayed on a per-collection bases will also be listed:
-
Analysis - lets you analyze the data found in specific fields.
-
Dataimport - shows you information about the current status of the Data Import Handler.
-
Documents - provides a simple form allowing you to execute various Solr indexing commands directly from the browser.
-
Files - shows the current core configuration files such as
solrconfig.xml. -
Query - lets you submit a structured query about various elements of a core.
-
Stream - allows you to submit streaming expressions and see results and parsing explanations.
-
Schema Browser - displays schema data in a browser window.