Distributed Tracing
Solr includes a general tracing framework based on OpenTracing that can be used to trace the lifecycle of a request for performance monitoring.
Tracing data can be configured to send to various backends, either directly or via an agent. Solr can send traces directly in OTLP/gRPC format. You can support many other destinations and cloud providers by installing an agent on each node and sending traces to localhost.
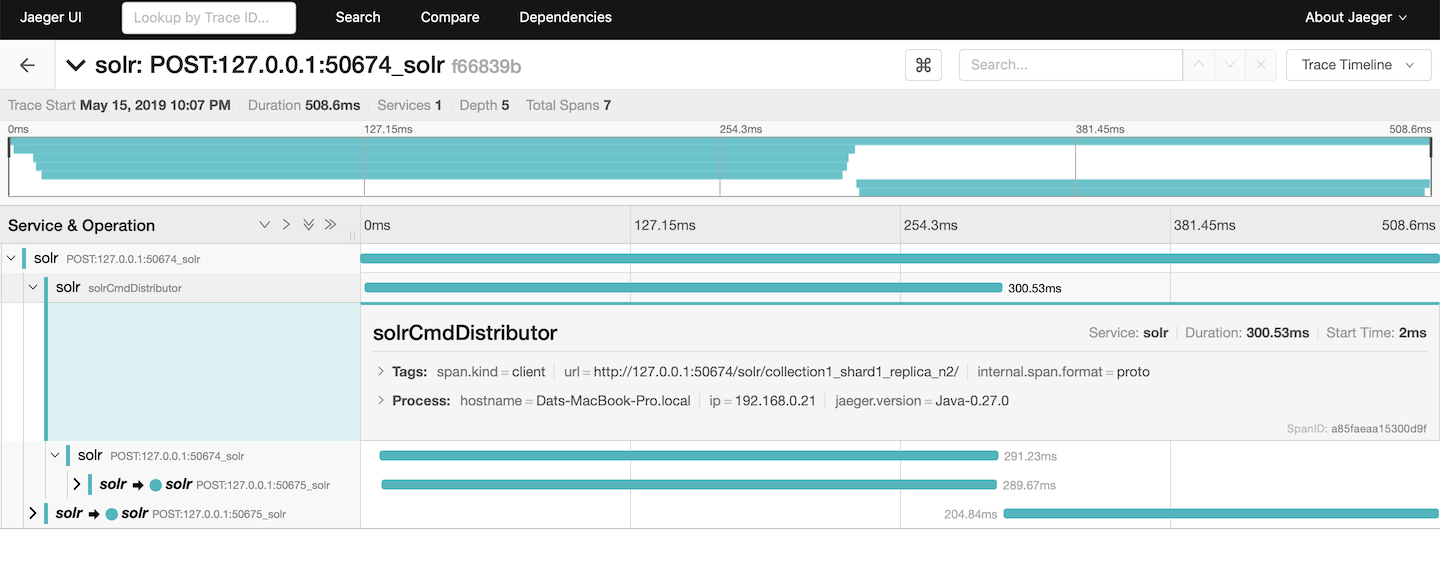
A sampled distributed tracing query request displayed in Jaeger UI looks like this:
Always-on Trace Id generation
Solr includes an always-on trace id generator. This will inject trace id headers for every Solr request, propagating the client supplied value or generating a new id as needed and replaces the existing rid mechanism.
The header name it uses for propagation is X-Trace-Id, this can be changed by updating the system property solr.traceIdHeader.
This plugin will not be enabled if another Tracing mechanism is setup via Solr config.
This plugin can be disabled by setting the solr.tracing.always.on.enabled system property to false.
Modules and Configuration
The TracerConfigurator is a class used to provide an instance of io.opentracing.Tracer based on configuration in solr.xml.
These are pluggable, and each plugin is shipped as a Solr Module:
opentelemetry: The opentelemetry module supports OTLP over gRPC or HTTP.
A setup of a TracerConfigurator in solr.xml looks like this:
<solr>
  <tracerConfig name="tracerConfig" class="org.apache.solr.opentelemetry.OtelTracerConfigurator" />
</solr>
If <tracerConfig> is absent, TracerConfigurator will try to pick up the Tracer instance that was registered in io.opentracing.util.GlobalTracer.
By doing this, some backends like DataDog are supported out of the box since datadog-java-agent uses Javaagent to register a Tracer in io.opentracing.util.GlobalTracer.
Open Telemetry Module
This module brings support for the industry standard OpenTelemetry (or short "OTEL") tracing, and exposes a tracer configurator that can be enabled in the <tracerConfig> tag of solr.xml as follows:
<tracerConfig name="tracerConfig" class="org.apache.solr.opentelemetry.OtelTracerConfigurator"/>As an alternative to changing the solr.xml file, the OTEL tracer will be enabled if the system property otel.service.name or environment variable OTEL_SERVICE_NAME is present. The opentelemetry module still needs to be enabled for the tracer to work.
Enable the module with either system property -Dsolr.modules=opentelemetry or environment variable SOLR_MODULES=opentelemetry.
Configuration
The tracer can be configured through environment variables or Java system properties, see OTEL SDK Environment Variables and Java SDK Autoconfigure.
The default configuration will ship traces to a collector running on localhost, using OTLP over gRPC, and will propagate trace IDs using W3C TraceContext. Here are the environment settings that are enabled by default:
OTEL_SDK_DISABLED=false
OTEL_SERVICE_NAME=solr
OTEL_TRACES_EXPORTER=otlp
OTEL_EXPORTER_OTLP_PROTOCOL=grpc
OTEL_EXPORTER_OTLP_ENDPOINT=localhost:4317
OTEL_TRACES_SAMPLER=parentbased_always_on
OTEL_PROPAGATORS=tracecontext,baggage
Say you want to send traces to a remote OTEL Collector, with 10% sampling. That could be done with this configuration:
OTEL_EXPORTER_OTLP_ENDPOINT=my-remote-collector:4317
OTEL_TRACES_SAMPLER=parentbased_traceidratio
OTEL_TRACES_SAMPLER_ARG=0.1
An equivalent configuration using system properties would be:
SOLR_OPTS=-Dotel.exporter.otlp.endpoint=my-remote-collector:4317 -Dotel.traces.sampler=parentbased_traceidratio -Dotel.traces.sampler.arg=0.1To add custom tags to the trace, use OTEL_RESOURCE_ATTRIBUTES:
OTEL_RESOURCE_ATTRIBUTES="application=OnlineBanking,exampleKey=exampleValue"Consult the OTEL documentation for details on all the configuration options. This version of Solr uses OpenTelemetry SDK v1.56.0.
Using other exporters
The OTEL tracer also supports other exporters like Jaeger and Zipkin. However, Solr does not ship with those 3rd party libraries, thus you need to add them to Solr yourself if you have this as a requirement. Say you add the Zipkin exporter jar file(s) to $SOLR_TIP/lib/, then you would enable OpenTelemetry module to send traces on the Zipkin format using the Protobuf encoding with a configuration like this:
OTEL_TRACES_EXPORTER=zipkin
OTEL_EXPORTER_ZIPKIN_ENDPOINT=http://localhost:9411/api/v2/spans