When running in SolrCloud mode, a "Cloud" option will appear in the Admin UI between Logging and Collections.
This screen provides status information about each collection & node in your cluster, as well as access to the low level data being stored in ZooKeeper.
|
Only Visible When using SolrCloud
The "Cloud" menu option is only available on Solr instances running in SolrCloud mode. Single node or master/slave replication instances of Solr will not display this option. |
Click on the "Cloud" option in the left-hand navigation, and a small sub-menu appears with options called "Nodes", "Tree", "Graph" and "Graph (Radial)". The sub-view selected by default is "Graph".
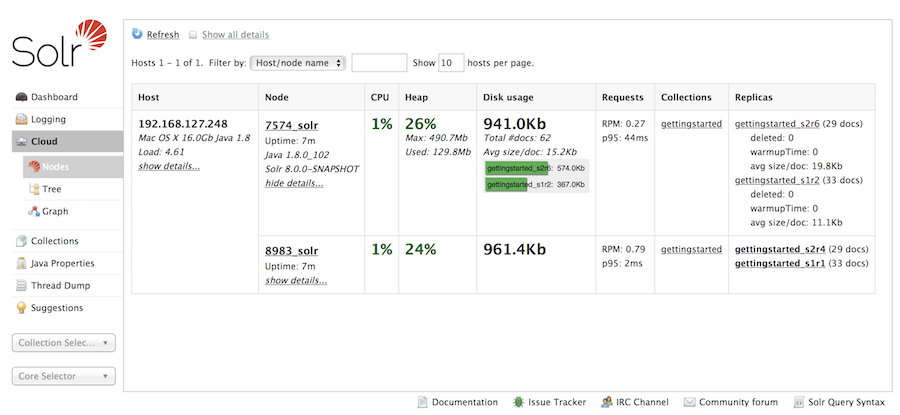
Nodes View
The "Nodes" view shows a list of the hosts and nodes in the cluster along with key information for each: "CPU", "Heap", "Disk usage", "Requests", "Collections" and "Replicas".
The example below shows the default "cloud" example with some documents added to the "gettingstarted" collection. Details are expanded for node on port 7574, showing more metadata and more metrics details. The screen provides links to navigate to nodes, collections and replicas. The table supports paging and filtering on host/node names and collection names.
Tree View
The "Tree" view shows a directory structure of the data in ZooKeeper, including cluster wide information regarding the live_nodes and overseer status, as well as collection specific information such as the state.json, current shard leaders, and configuration files in use. In this example, we see part of the state.json definition for the "tlog" collection:
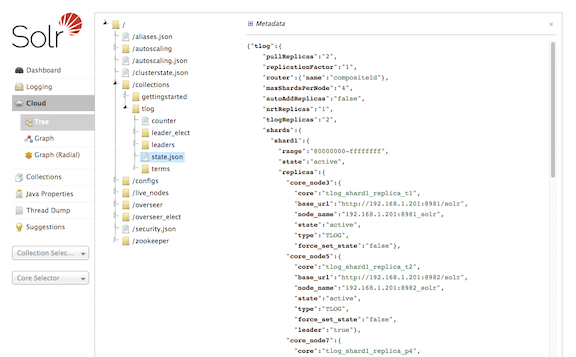
As an aid to debugging, the data shown in the "Tree" view can be exported locally using the following command bin/solr zk ls -r /
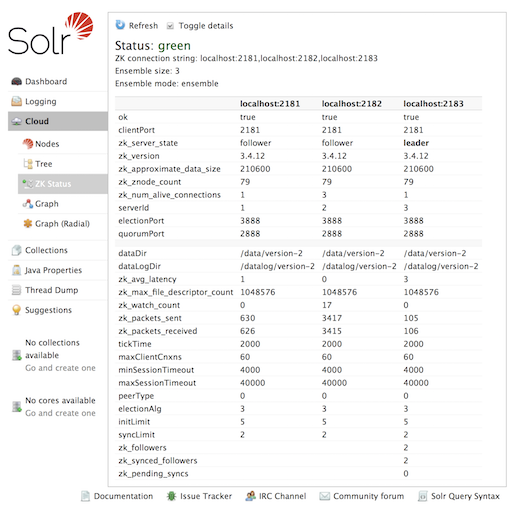
ZK Status View
The "ZK Status" view gives an overview over the Zookeepers used by Solr. It lists whether running in standalone or ensemble mode, shows how many zookeepers are configured, and then displays a table listing detailed monitoring status for each of the zookeepers, including who is the leader, configuration parameters and more.
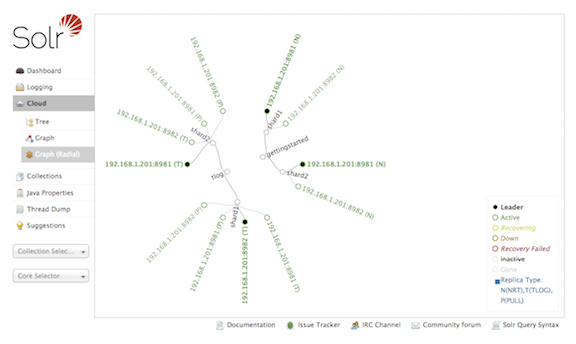
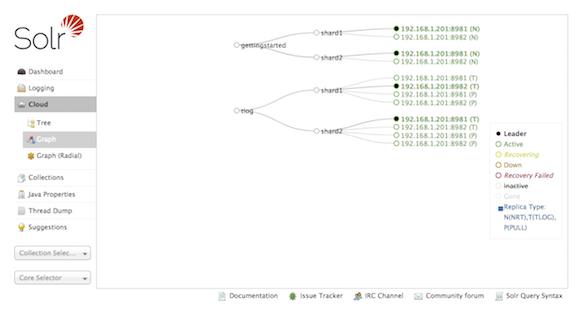
Graph Views
The "Graph" view shows a graph of each collection, the shards that make up those collections, and the addresses and type ("NRT", "TLOG" or "PULL") of each replica for each shard.
This example shows a simple cluster. In addition to the 2 shard, 2 replica "gettingstarted" collection, there is an additional "tlog" collection consisting of mixed TLOG and PULL replica types.
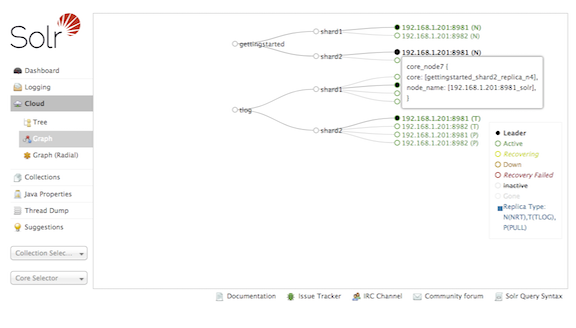
Tooltips appear when hovering over each replica giving additional information.
The "Graph (Radial)" option provides a different visual view of each node. Using the same example cluster, the radial graph view looks like: