Monitoring Solr with Prometheus and Grafana
If you use Prometheus and Grafana for metrics storage and data visualization, Solr includes a Prometheus exporter to collect metrics and other data.
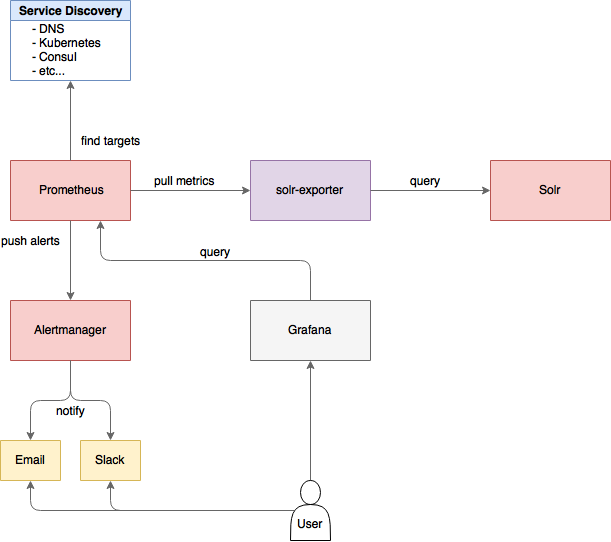
A Prometheus exporter (solr-exporter) allows users to monitor not only Solr metrics which come from Metrics API, but also facet counts which come from Searching and responses to Collections API commands and PingRequestHandler requests.
This graphic provides a more detailed view:
| This feature is considered experimental, meaning future improvements may break compatibility. |
The Prometheus exporter is included in Solr as a contrib, and is located in contrib/prometheus-exporter in your Solr instance.
There are three aspects to running solr-exporter:
- Modify the
solr-exporter-config.xmlto define the data to collect. Solr has a default configuration you can use, but if you would like to modify it before running the exporter the first time, see the section below Exporter Configuration. - Start the exporter from within Solr. See the section below Starting the Exporter.
- Modify your Prometheus configuration to listen on the correct port. See the section below Prometheus Configuration
Starting the Exporter
You can start solr-exporter by running ./bin/solr-exporter (Linux) or .\bin\solr-exporter.cmd (Windows) from the contrib/prometheus-exporter directory.
See the commands below depending on your operating system and Solr operating mode:
Linux
$ cd contrib/prometheus-exporter
$ ./bin/solr-exporter -p 9854 -b http://localhost:8983/solr -f ./conf/solr-exporter-config.xml -n 8$ cd contrib/prometheus-exporter
$ ./bin/solr-exporter -p 9854 -z localhost:2181/solr -f ./conf/solr-exporter-config.xml -n 16Windows
> cd contrib\prometheus-exporter
> .\bin\solr-exporter.cmd -p 9854 -b http://localhost:8983/solr -f .\conf\solr-exporter-config.xml -n 8> cd contrib\prometheus-exporter
> .\bin\solr-exporter -p 9854 -z localhost:2181/solr -f .\conf\solr-exporter-config.xml -n 16Command Line Parameters
The parameters in the example start commands shown above:
h,--help- Displays command line help and usage.
-p,--port- The port where Prometheus will listen for new data. This port will be used to configure Prometheus. It can be any port not already in use on your server. The default is
9983. -b,--baseurl- The Solr base URL (such as
http://localhost:8983/solr) when Solr is running in Standalone mode. If you are running Solr in SolrCloud mode, do not specify this parameter. If neither the-bparameter nor the-zparameter are defined, the default is-b http://localhost:8983/solr. -z,--zkhost- The ZooKeeper connect string (such as
localhost:8983, orlocalhost:2181/solr) when Solr is running in SolrCloud mode. If you are running Solr in Standalone mode, do not specify this parameter. If neither the-bparameter nor the-zparameter are defined, the-bparameter default is used. -f,--config-file- The path to the configuration file that defines the Solr metrics to read. The default is
contrib/prometheus-exporter/conf/solr-exporter-config.xml. -n,--num-threads- The number of threads. The
solr-exportercreates thread pools for requests to Solr. Request latency can be improved by increasing the number of threads. The default is1. -s,--scrape-interval- The number of seconds between collecting metrics from Solr. The
solr-exportercollects metrics from Solr every few seconds controlled by this setting. These metrics are cached and returned regardless of how frequently prometheus is configured to pull metrics from this tool. The freshness of the metrics can be improved by reducing the scrape interval but do not set it to a very low value because metrics collection can be expensive and can execute arbitrary searches to ping Solr. The default value is 60 seconds.
The Solr’s metrics exposed by solr-exporter can be seen at: http://localhost:9983/solr/admin/metrics.
Getting metrics from a secure Solr(Cloud)
Your Solr(Cloud) might be secured by measures described in Securing Solr. The security configuration can be injected into solr-exporter using environment variables in a fashion similar to other clients using SolrJ. This is possible because the main script picks up two external environment variables and passes them on to the Java process:
JAVA_OPTSallows to add extra JVM optionsCLASSPATH_PREFIXallows to add extra libraries
Example for a SolrCloud instance secured by Basic Authentication, SSL and ZooKeeper Access Control:
Suppose you have a file basicauth.properties with the Solr Basic-Auth credentials:
httpBasicAuthUser=myUser
httpBasicAuthPassword=myPassword
Then you can start the Exporter as follows (Linux).
$ cd contrib/prometheus-exporter
$ export JAVA_OPTS="-Djavax.net.ssl.trustStore=truststore.jks -Djavax.net.ssl.trustStorePassword=truststorePassword -Dsolr.httpclient.builder.factory=org.apache.solr.client.solrj.impl.PreemptiveBasicAuthClientBuilderFactory -Dsolr.httpclient.config=basicauth.properties -DzkCredentialsProvider=org.apache.solr.common.cloud.VMParamsSingleSetCredentialsDigestZkCredentialsProvider -DzkDigestUsername=readonly-user -DzkDigestPassword=zkUserPassword"
$ export CLASSPATH_PREFIX="../../server/solr-webapp/webapp/WEB-INF/lib/commons-codec-1.11.jar"
$ ./bin/solr-exporter -p 9854 -z zk1:2181,zk2:2181,zk3:2181 -f ./conf/solr-exporter-config.xml -n 16
Note: The Exporter needs the commons-codec library for SSL/BasicAuth, but does not bring it. Therefore the example reuses it from the Solr web app. Of course, you can use a different source.
Exporter Configuration
The configuration for the solr-exporter defines the data to get from Solr. This includes the metrics, but can also include queries to the PingRequestHandler, the Collections API, and a query to any query request handler.
A default example configuration is in contrib/prometheus-exporter/config/solr-exporter-config.xml. Below is a slightly shortened version of it:
<config>

  <rules>

    <ping>
      <lst name="request">
        <lst name="query">
          <str name="path">/admin/ping</str>
        </lst>
        <arr name="jsonQueries">
          <str>
            . as $object | $object |
            (if $object.status == "OK" then 1.0 else 0.0 end) as $value |
            {
              name         : "solr_ping",
              type         : "GAUGE",
              help         : "See following URL: https://lucene.apache.org/solr/guide/ping.html",
              label_names  : [],
              label_values : [],
              value        : $value
            }
          </str>
        </arr>
      </lst>
    </ping>

    <metrics>
      <lst name="request">
        <lst name="query">
          <str name="path">/admin/metrics</str>
          <lst name="params">
            <str name="group">all</str>
            <str name="type">all</str>
            <str name="prefix"></str>
            <str name="property"></str>
          </lst>
        </lst>
        <arr name="jsonQueries">
          <!--
            jetty metrics
          -->
          <str>
            .metrics["solr.jetty"] | to_entries | .[] | select(.key | startswith("org.eclipse.jetty.server.handler.DefaultHandler")) | select(.key | endswith("xx-responses")) as $object |
            $object.key | split(".") | last | split("-") | first as $status |
            $object.value.count as $value |
            {
            name         : "solr_metrics_jetty_response_total",
            type         : "COUNTER",
            help         : "See following URL: https://lucene.apache.org/solr/guide/metrics-reporting.html",
            label_names  : ["status"],
            label_values : [$status],
            value        : $value
            }
          </str>
...
        </arr>
      </lst>
    </metrics>

    <collections>
      <lst name="request">
        <lst name="query">
          <str name="path">/admin/collections</str>
          <lst name="params">
            <str name="action">CLUSTERSTATUS</str>
          </lst>
        </lst>
        <arr name="jsonQueries">
          <str>
            .cluster.live_nodes | length as $value|
            {
              name         : "solr_collections_live_nodes",
              type         : "GAUGE",
              help         : "See following URL: https://lucene.apache.org/solr/guide/collections-api.html#clusterstatus",
              label_names  : [],
              label_values : [],
              value        : $value
            }
          </str>
...
        </arr>
      </lst>
    </collections>

    <search>
      <lst name="request">
        <lst name="query">
          <str name="collection">collection1</str>
          <str name="path">/select</str>
          <lst name="params">
            <str name="q">*:*</str>
            <str name="start">0</str>
            <str name="rows">0</str>
            <str name="json.facet">
              {
                category: {
                  type: terms,
                  field: cat
                }
              }
            </str>
          </lst>
        </lst>
        <arr name="jsonQueries">
          <str>
            .facets.category.buckets[] as $object |
            $object.val as $term |
            $object.count as $value |
            {
              name         : "solr_facets_category",
              type         : "GAUGE",
              help         : "Category facets",
              label_names  : ["term"],
              label_values : [$term],
              value        : $value
            }
          </str>
        </arr>
      </lst>
    </search>

  </rules>

</config>
Configuration Tags and Elements
The solr-exporter works by making a request to Solr according to the definitions in the configuration file, scraping the response, and converting it to a JSON structure Prometheus can understand. The configuration file defines the elements to request, how to scrape them, and where to place the extracted data in the JSON template.
The solr-exporter configuration file always starts and closes with two simple elements:
<config>
  <rules>

  </rules>
</config>
Between these elements, the data the solr-exporter should request is defined. There are several possible types of requests to make:
<ping> | Scrape the response to a PingRequestHandler request. |
<metrics> | Scrape the response to a Metrics API request. |
<collections> | Scrape the response to a Collections API request. |
<search> | Scrape the response to a search request. |
Within each of these types, we need to define the query and how to work with the response. To do this, we define two additional elements:
<query>- Defines the query parameter(s) used for the request. This section uses several additional properties to define your query:
collection- The collection to issue the query against. Only used in SolrCloud mode.
core- The core to issue the query against. Only used in Standalone mode.
path- The path to the query endpoint where the request will be sent. Examples include
admin/metricsor/selectoradmin/collections. params- Additional query parameters. These will vary depending on the request type and the endpoint. For example, if using the Metrics endpoint, you can add parameters to limit the query to a certain group and/or prefix. If you’re using the Collections API, the command you want to use would be a parameter.
<jsonQueries>This is an array that defines one or more JSON Queries in jq syntax. For more details about how to structure these queries, see the jq user manual.
A jq query has to output JSON in the following format:
{
  "name": "solr_ping",
  "type": "GAUGE",
  "help": "See following URL: https://lucene.apache.org/solr/guide/ping.html",
  "label_names": ["base_url","core"],
  "label_values": ["http://localhost:8983/solr","collection1"],
  "value": 1.0
}
See the section Exposition Format below for information about what information should go into each property, and an example of how the above example is translated for Prometheus.
Exposition Format
The solr-exporter converts the JSON to the following exposition format:
# TYPE <name> <type>
# HELP <name> <help>
<name>{<label_names[0]>=<label_values[0]>,<label_names[1]>=<labelvalues[1]>,...} <value>
The following parameters should be set:
name- The metric name to set. For more details, see Prometheus naming best practices.
type- The type of the metric, can be
COUNTER,GAUGE,SUMMARY,HISTOGRAMorUNTYPED. For more details, see Prometheus metric types. help- Help text for the metric.
label_names- Label names for the metric. For more details, see Prometheus naming best practices.
label_values- Label values for the metric. For more details, see Prometheus naming best practices.
value- Value for the metric. Value must be set to Double type.
For example, solr-exporter converts the JSON in the previous section to the following:
# TYPE solr_ping gauge
# HELP solr_ping See following URL: https://lucene.apache.org/solr/guide/ping.html
solr_ping{base_url="http://localhost:8983/solr",core="collection1"} 1.0
Prometheus Configuration
In order for Prometheus to know about the solr-exporter, the listen address must be added to prometheus.yml, as in this example:
scrape_configs:
  - job_name: 'solr'
    static_configs:
      - targets: ['localhost:9854']
If you already have a section for scrape_configs, you can add the job_name and other values in the same section.
When you apply the settings to Prometheus, it will start to pull Solr’s metrics from solr-exporter.
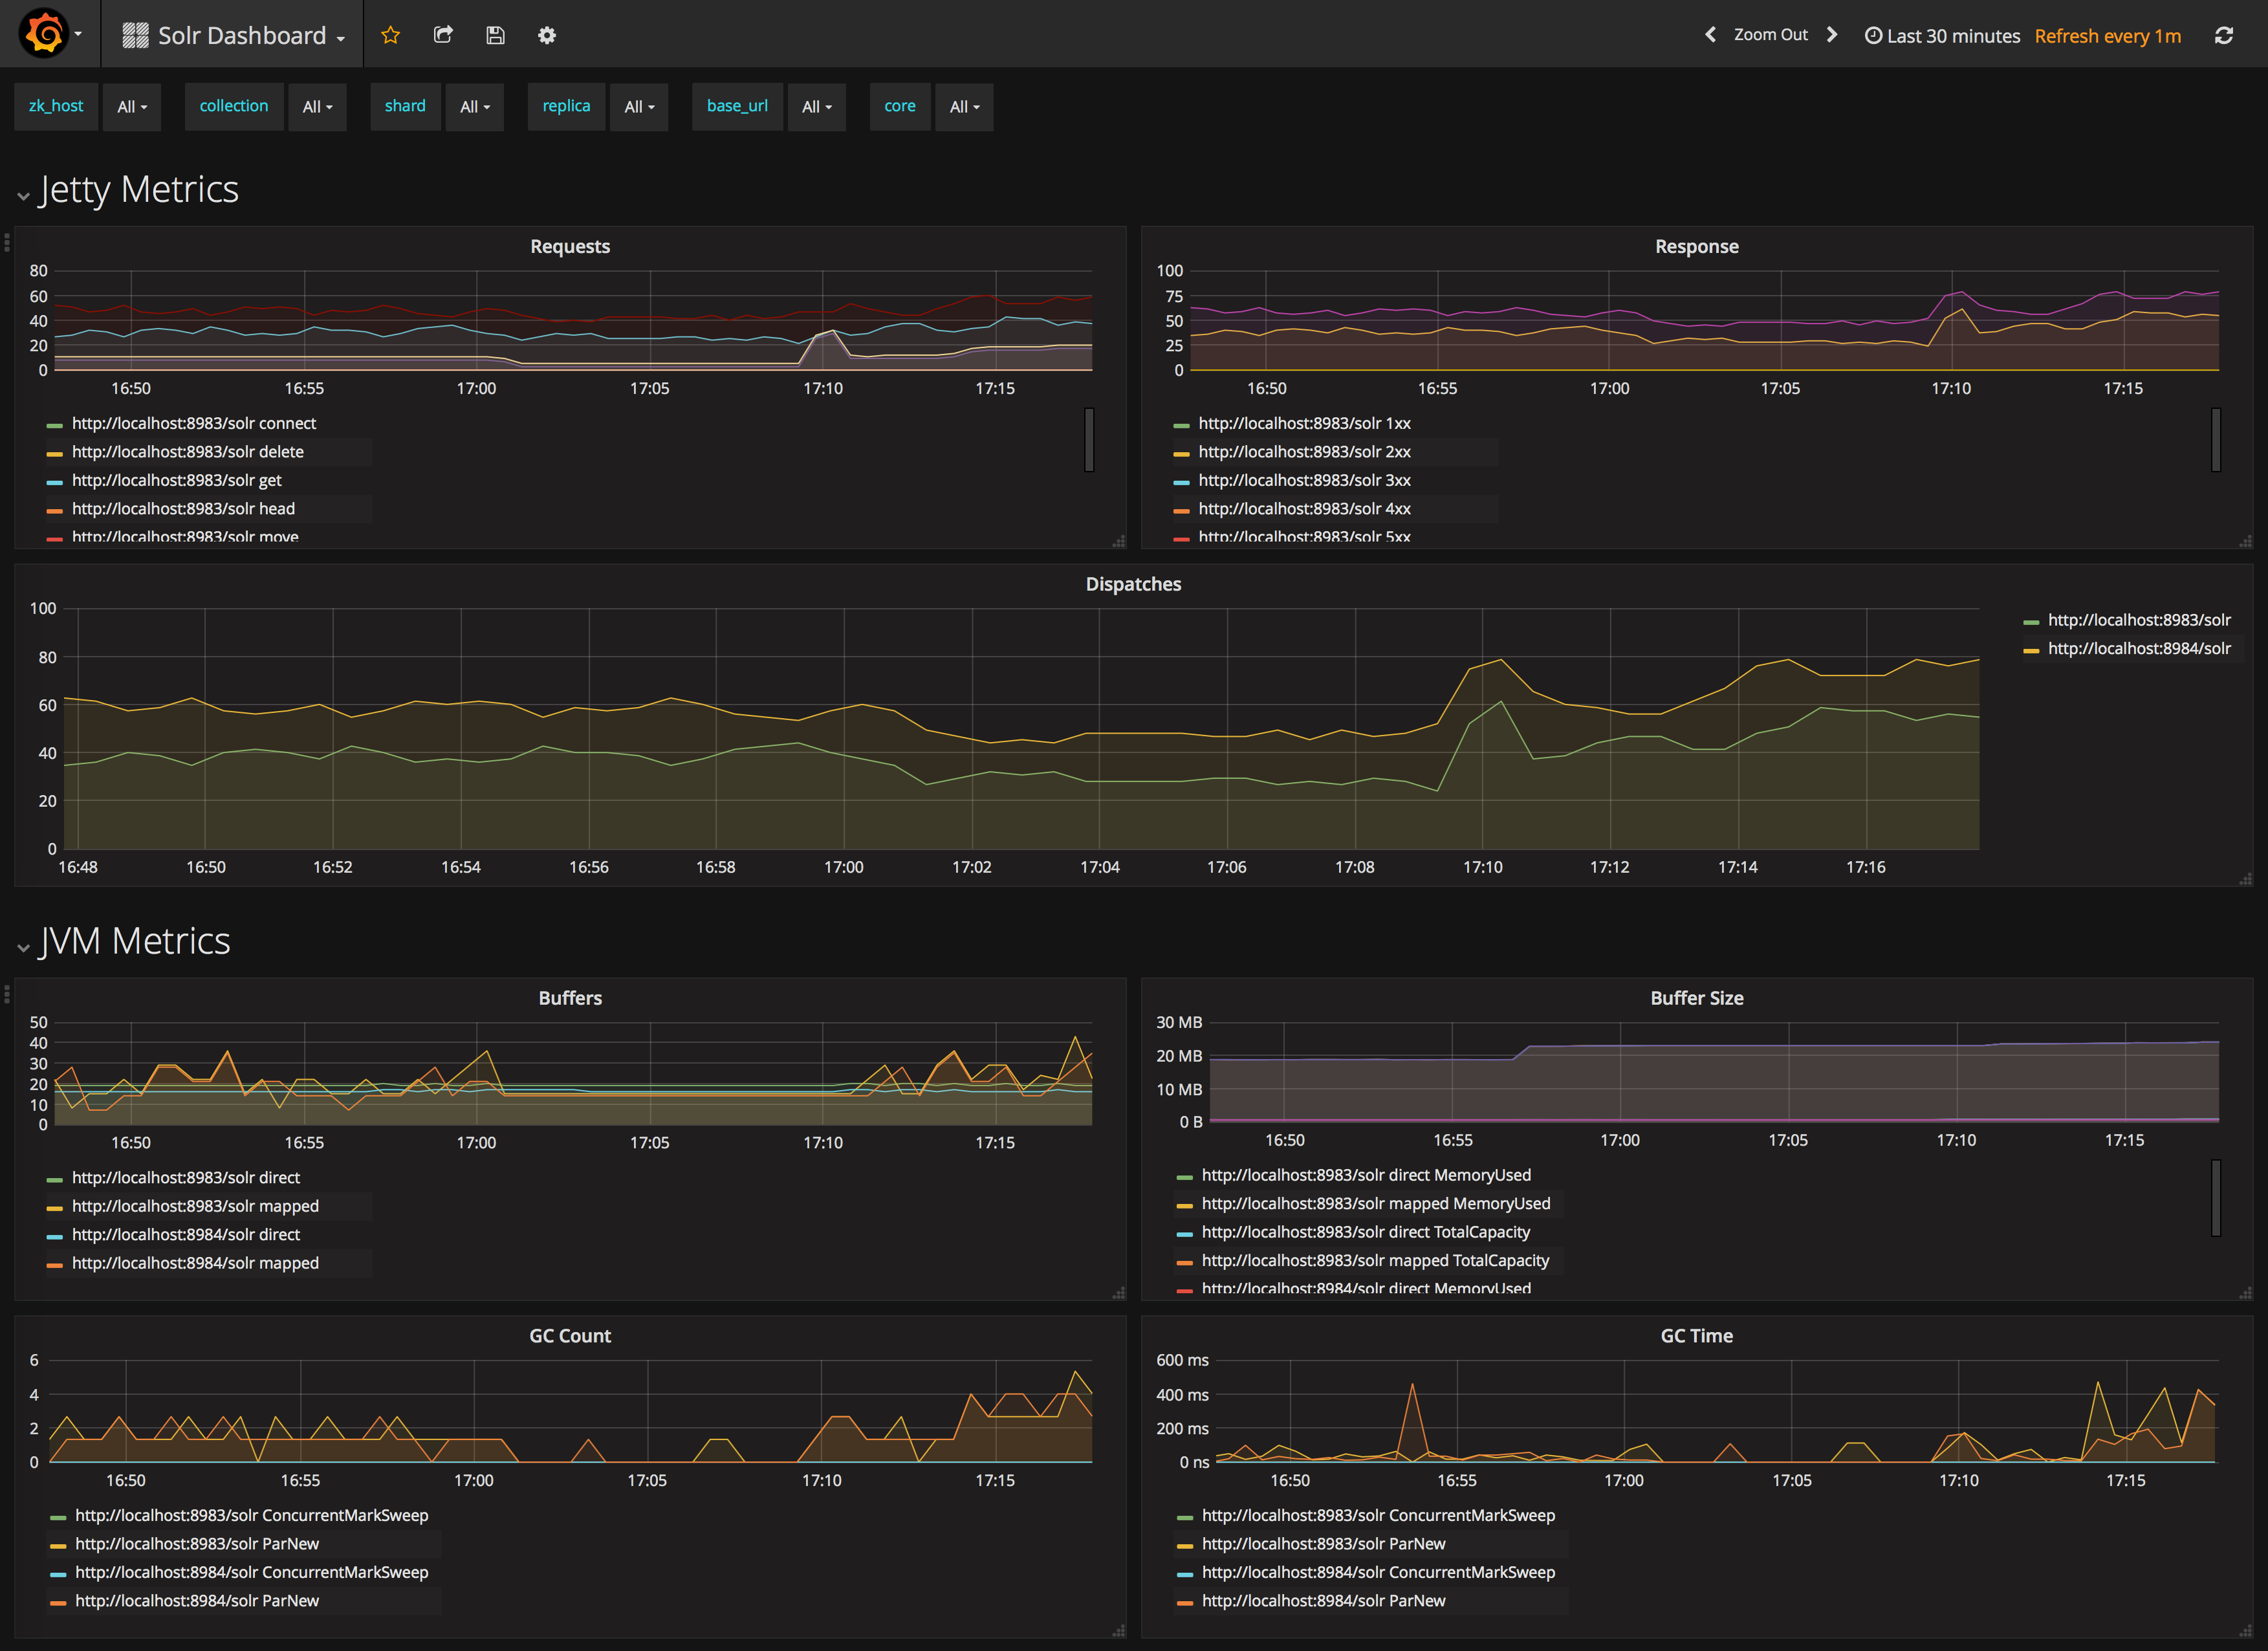
Sample Grafana Dashboard
A Grafana sample dashboard is provided in the following JSON file: contrib/prometheus-exporter/conf/grafana-solr-dashboard.json.
You can place this with your other Grafana dashboard configurations and modify it as necessary depending on any customization you’ve done for the solr-exporter configuration.
This screenshot shows what it might look like: