Distributed Tracing
Solr uses OpenTelemetry APIs/standards for its distributed tracing support. Tracing is an observability signal focused on diagnosing performance of requests across distributed systems.
The power of tracing is best appreciated in visualizing a distributed request over a time axis as a tree of layered temporal spans emitted by systems and sub-systems/components. A sampled distributed tracing query request displayed in Jaeger looks like this:
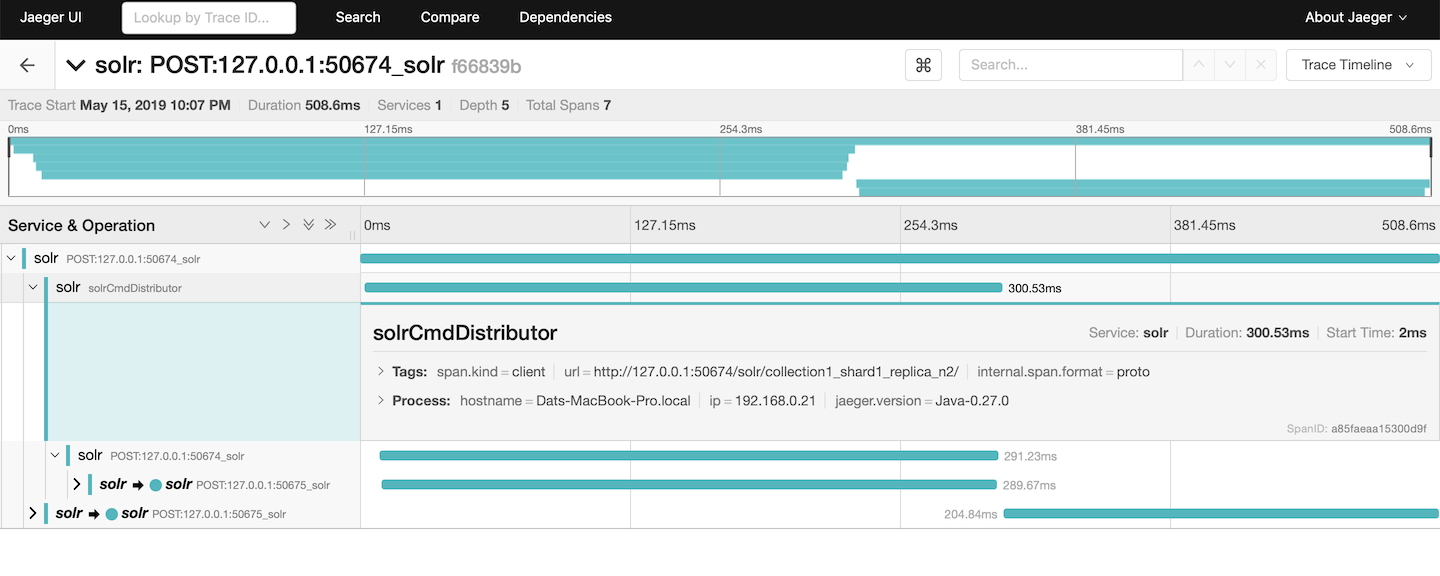
While logs and metrics can be observed directly in Solr, tracing requires that you integrate with an OTEL compliant server that includes visualization capabilities or is part of a larger system plumbed into one.
See OpenTelemetry for the ways to do that — a Java agent, Solr’s opentelemetry module, or a custom configurator — and how each is configured.
This page describes what Solr emits once one of them is in place.
Spans
Solr names a request span after the operation and the path it resolves to, as verb:_path_.
The verb is the action request parameter when there is one, otherwise the lowercased HTTP method.
The path is prefixed with /{core} or /{collection} when the request targets one, so that spans group by operation rather than by which core happened to serve them.
For example, get:/{collection}/select, post:/{core}/update, list:/admin/collections, or reload:/admin/cores.
These spans have kind SERVER.
Collection API commands that Solr runs internally produce a span named after the command, such as CreateCollectionCmd or ReloadCollectionCmd, of kind CLIENT — or PRODUCER when the command was submitted asynchronously.
These are the parent of the per-node work the command fans out.
Spans carry these attributes, where applicable:
| Attribute | Description |
|---|---|
|
The core or collection the request targets. |
|
Always |
|
The authenticated user, when a security plugin is in use. |
|
The HTTP method. |
|
The HTTP status code. |
|
The request URL. |
|
The query string. |
|
On a security configuration request, the operation names in the payload. |
|
The security plugin class that handled those operations. |
Solr injects the trace context into the requests it makes to other Solr nodes, so a client request and all the internal requests it causes share one trace.
The header used depends on the configured propagator; by default that is W3C TraceContext, which uses traceparent.
Sampling
Tracing every request is rarely affordable in production.
Sampling is an SDK setting, so it applies when you use the opentelemetry module; with a Java agent, configure sampling through the agent.
The module defaults to parentbased_always_on, which records every trace that Solr starts and honors the decision of an upstream caller when there is one.
To record 10% of traces instead:
OTEL_TRACES_SAMPLER=parentbased_traceidratio
OTEL_TRACES_SAMPLER_ARG=0.1
The equivalent with system properties:
SOLR_OPTS="-Dotel.traces.sampler=parentbased_traceidratio -Dotel.traces.sampler.arg=0.1"Because the default is parent-based, a sampling decision made by the client that called Solr is respected either way.
Always-on Trace Id generation
If no other OTEL configuration/integration is active, Solr includes a simple "always-on" trace id generator. This will create an internal trace ID and propagate them in an HTTP header on every request Solr makes, thus appearing in Solr’s logs.
The header name it uses for propagation is X-Trace-Id, which can be changed by updating the system property solr.traceIdHeader.
Solr puts the trace ID into the logging MDC as trace_id, and the default log4j2.xml already includes it in the log pattern as t:%X{trace_id}, so a trace ID looks like this in a log line:
2026-09-21 10:15:42.123 INFO (qtp1234-25) [c:techproducts s:shard1 r:core_node2 x:techproducts_shard1_replica_n1 t:solr-node1-17] o.a.s.c.S.Request webapp=/solr path=/select params={q=*:*}This means you can follow one request across every node’s log without any tracing backend at all. See Configuring Logging to change the pattern.
This mechanism is a default for when no other tracing configuration is in effect. Those mechanisms will generally at least do what this does anyway.
This mechanism can be disabled by setting the solr.tracing.always.on.enabled system property to false.